
After the steel forms austenite during the heating transition, a structural transformation occurs during the subsequent cooling. The transition can be carried out at a constant temperature or during a continuous cooling process. The transformation products of austenite are also different depending on the cooling conditions. Under the actual cooling conditions, although the austenite cools below the A1 point, it does not immediately change, and the austenite present in this case is called "supercooled austenite". Since the transition of supercooled austenite is a non-equilibrium process, it cannot be completely analyzed based on the Fe-Fe3C equilibrium diagram. In order to grasp the transformation behavior of austenite under supercooled conditions, a supercooled austenite transformation diagram, also known as a supercooled austenite transformation curve, was established by experimental means.
The supercooled austenite transformation diagram is a graph used to indicate the start and end time of the supercooled austenite transformation process and the temperature range of various types of tissue transformation under different cooling conditions. If the transformation is carried out at a constant temperature, there is Undercooled austenite isothermal transformation diagram; if the transformation is carried out under continuous cooling conditions, there is a supercooled austenite continuous cooling transition diagram.
This chapter mainly discusses the transformation law and application of cold austenite when it is isothermally cooled at different temperatures or at different speeds.
6.1 Supercooled austenite transformation diagram
During continuous cooling, the supercooled austenite transformation occurs over a large temperature range. There may be several different types of transitions that overlap. First, we discuss the relatively simple supercooled austenite isothermal transformation.
6.1.1 Establishment of isothermal transformation diagram of supercooled austenite
The austenite is rapidly cooled to a certain temperature below the critical temperature and is isothermal at this temperature, and the phase transition occurring during the isothermal process is called the supercooled austenite isothermal transformation.
Metals in the transformation of the structure must be accompanied by changes in certain physical properties, such as changes in volume, magnetism, resistivity, etc., while also releasing or absorbing latent heat of phase change, which can be used for metallography, expansion, magnetism, electrical resistance and thermal analysis. The method determines the isothermal transition map. The method of determining the isothermal transition map is briefly described below with the metallographic method as the side.
A certain kind of carbon steel is processed into many samples of the same size (such as φ10 ~ 15mm × 1.5mm), and divided into several groups, each time taking a group for austenitizing, obtaining a uniform austenite structure, quickly It is placed in a salt bath furnace at a temperature below Ac1 (such as 650 ° C), kept at a constant temperature, and then one of the samples is taken out at regular intervals to quench the untransformed austenite into martensite. The type and amount of conversion product of the sample were determined by metallographic method, wherein the amount of martensite indicates the amount of untransformed supercooled austenite. The relationship between the amount of supercooled austenite transformation at this temperature and time is plotted. Then take the second set of samples in the same way at another temperature isothermal (such as 600 ° C), also plot the amount of supercooled austenite transformation at this temperature versus time. Figure 6-1(a) is a plot of the amount of transition at different temperatures versus time. It can be seen from the figure that the transition at each isothermal temperature has a gestation period. After the start of the transition, the speed of change gradually increases. When the amount of change reaches about 50%, the speed of change is the largest, and then gradually decreases until the end of the transition.
If the isothermal transition start time and end time at different temperatures are plotted in the temperature-time semi-logarithmic coordinate system, and the transition start point and the transition end point at different temperatures are respectively connected into a curve, then see Figure 6- 1(b) supercooled austenite isothermal transformation diagram. The supercooled austenite isothermal transformation map can reflect the isothermal transformation process of supercooled austenite at different temperatures, the start and end time of transformation, the type of transformation products, and the relationship between the amount of transformation and temperature and time. Since the isothermal transition map usually has a "C" shape, it is also called a C curve, also called a TTT (Temperature Time Transformation) map. In the figure, the ABCD line represents the start of the transition at different temperatures (usually taking about 2% of the transition), while the EFGH line and the JK and LM lines indicate that 50% and 100% (actually about 98%) transitions occur, respectively. time.
The isothermal transition curve in Figure 6-1(b) can be thought of as consisting of two "C" shaped curves. The first "C" shaped curve is relatively straight with the pearlite transition zone, and the second "C" shape The curve corresponds to the bainite transformation zone. The two convex parts in the curve are called the "nose" of the pearlite and bainite transformation curves, respectively, which correspond to the shortest temperature during the pearly and bainite transformation. A pearlite and bainite mixed structure can be obtained when isothermally in a region where the two curves overlap (550 ° C in Fig. 6-2). In the pearlite region, as the isothermal temperature decreases, the pearlite sheet spacing decreases and the pearlite structure becomes thinner. Upper bainite is obtained when the bainite region is isothermal at a higher temperature, and lower bainite is obtained when the temperature is isothermal in a lower temperature region.
For steels with higher Ms points, the bainite isothermal transformation curve can extend below the Ms line, ie, the bainite and martensite transformation overlap. If it is isothermally lower than the temperature of Ms, then a small amount of martensite is formed and then bainite is formed.
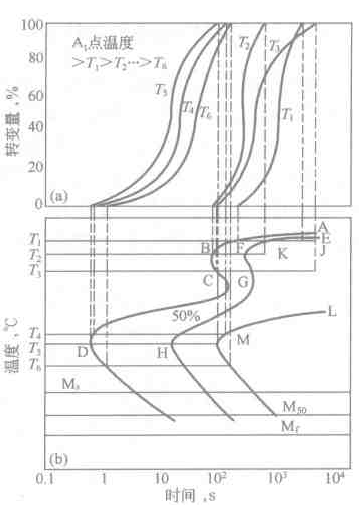
Figure 6-1 Establishment of the isothermal transformation diagram of supercooled austenite
(a) isothermal transformation kinetic curves at different temperatures; (b) undercooled austenite isothermal transformation diagram
For the hypoeutectoid steel and the hypereutectoid steel, the pro-eutectoid ferrite and the pro-eutectoid cementite are separately precipitated before the pearlite transformation, so that they have one more pro-eutectoid ferrite on the C-curve. The precipitation line of the body and the pro-eutectoid cementite, Figure 6-2 is a typical hypoeutectoid steel C curve, with a precipitation line of pro-eutectoid ferrite. Usually, the critical points Ac1, Ac3, Ms, Mf and the respective phase regions (A or r, F or a, P, B, C-carbide) are indicated in the figure, and the hardness of the transformed product and various types of tissues are sometimes indicated. Percentage.
The C curve of the eutectoid carbon steel is a simple "C" shape, which can actually be seen as a combination of two adjacent C curves, as shown in Figure 6-3. At isothermal temperatures above the tip of the nose (>550 °C), Pearlite is formed; bainite is formed when the temperature is isothermal below the tip of the nose.
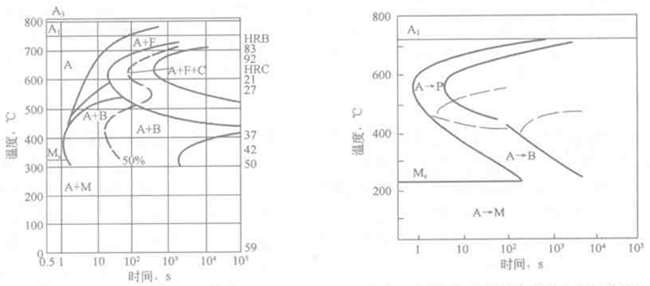
Figure 6-2 TTT curve of 40Cr steel Figure 6-3 Two C curves combined into one C curve
6.1.2 Basic types and influencing factors of isothermal transformation diagram of supercooled austenite
Different alloying elements have different influences on the cooling transition temperature range and transition speed of supercooled austenite, resulting in various shapes of C curves. The basic types of common C curves are roughly as follows.
The first one has a single "C" shape curve. The pearlite transformation partially overlaps with the C-transform C curve, and pearlite is formed when the temperature is isothermal above the tip of the nose; bainite is formed when the temperature is isothermal below the tip of the nose. Except for eutectoid carbon steel, steels containing Si, Ni, Co and other elements belong to this category. Except for some alloying elements such as Co, most alloying elements such as Ni, Cr, Mn, Si, W, Mo, B, etc. Will move the C curve position to the right, see Figure 6-4.
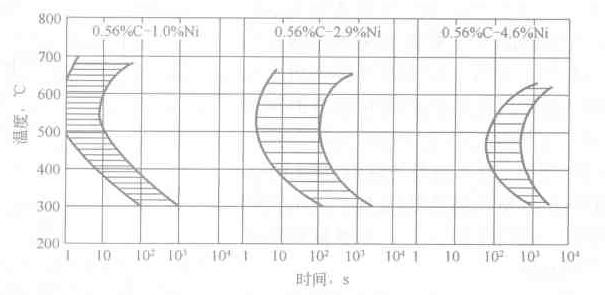
Figure 6-4 Effect of Ni on C curve
In the second and third, the curve has a double "C" shape. When adding alloying elements such as Cr, M0, w, V, etc., which can lower the bainite transformation temperature range or increase the pearlite transformation temperature range, the pearlite transformation C curve increases with the increase of the alloy elemental content. Gradually separate from the Ba-body transformation C curve, see Figure 6-5. When the alloying element content is sufficiently high, the two curves will be completely separated, and an austenite stabilizing zone will appear between the pearlite transformation and the Bayesian transition.

Figure 6-5 Effect of Cr on C curve
If the added alloying elements not only can separate the pearlite transformation from the bainite transformation, but also can significantly reduce the pearlite transformation speed, but have little effect on the bainite transformation speed, then the results shown in Figure 6-6 will be obtained. Isothermal transition diagram (second type), which is often found in steels containing strong carbide forming elements such as Cr, Mo, w, and V. 6-6 is a C curve measured after austenitizing 45CrMo steel at 860 ° C, wherein the A1 line is 730 ° C, the A3 line is 800 ° C, and the Ms line is 310 ° C. If the added alloying elements can significantly slow down the bainite transformation rate and have little effect on the pearlite transformation speed, the isothermal transformation diagram (third type) shown in Figure 6-7 will be obtained. It is often found in alloy steels with higher carbon content. 6-7 is a C curve measured after austenitizing W18Cr4V steel at 1290 ° C, wherein A1s is 810 ° C, and A1f is 860 ° C. Ms is 140 °C.
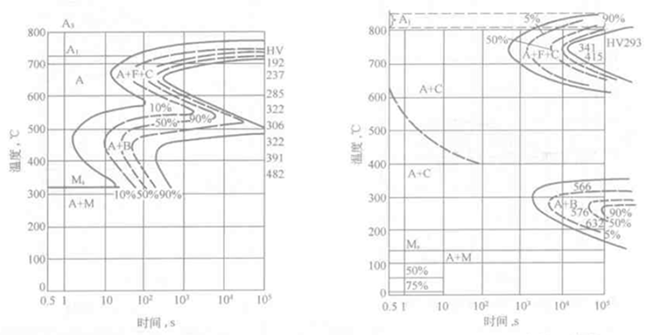
Figure 6-C curve of 645CrMo steel Figure 6-7 C curve of W18Cr4V steel
The effect of Mn on the austenite isothermal transformation diagram is special. When the amount of Mn added to the steel is small, only a single C curve appears. However, when the amount of Mn increases to 1.5% or more, separation occurs at the later stage of the transformation, as shown in Fig. 6-8. Continue to increase the Mn amount to 3% or more. At the same time, a double C-shaped curve is also presented, as shown in Figure 6-9.

Figure 6-8 C curve of 0.42% C-1.8% Mn steel Figure 6-9 C curve of 0.2C-3.2% Mn steel
The fourth type is the C curve with only bainite transformation. In steels with low carbon content (<0.25%) and high Mn, Cr, Ni, W, and Mo content, the diffusion type pearlite transformation is greatly hindered, and only the Bainite transformation C curve appears, as shown in Fig. 6. -10. 18Cr2Ni4WA, 18Cr2Ni4MoA steel are examples of this.
The fifth type, only the C curve of the pearl shift. This is because the action of the alloying elements greatly prolongs the bainite transformation, so that the bainite transformation curve does not appear in the figure. This isothermal transition diagram appears in medium carbon high chromium steels (eg 3Cr13, 4Cr13, etc.), see Figure 6-11.
In the sixth case, the C curve does not appear in the entire temperature range above the martensite point (Ms). This type of steel pearlite transformation and bainite transformation are strongly suppressed, usually austenitic steel. The austenitic structure that is stable at high temperatures is all over the cold room at room temperature. However, there may be a high temperature precipitation of excess carbide, resulting in a carbide precipitation C-shaped curve above the Ms point, see Figure 6-12, such as 4Crl4Nil4W2Mo steel.
It should be noted that the shape of the C-curve is related to the chemical composition of the steel and to the heat treatment process of the steel. Such as refinement of austenite grains, will accelerate the transformation of supercooled austenite to pearlite. When the original microstructure is the same, increasing the austenitizing temperature or prolonging the austenitizing time will promote the dissolution of carbides, uniform composition and austenite grain growth. Causes a right shift of the C curve, and so on. In addition, the high temperature or low temperature deformation of austenite can significantly affect the pearlite transformation kinetics. In general, the larger the shape variable, the shorter the pearlescent transformation period, that is, the accelerated spheroidal transformation.
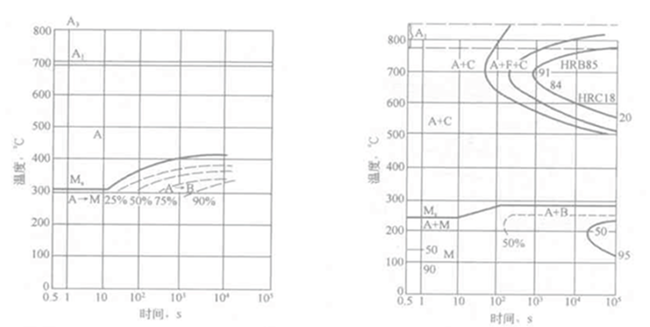
Figure 6-10 C curve of 18Cr2Ni4WA steel Figure 6-11 C curve of 3Cr13 steel
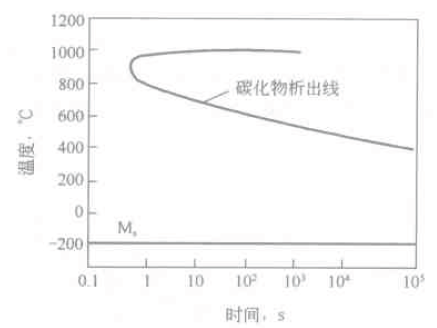
Figure 6-12 C curve with only carbide precipitation
In summary, the shape and location of the austenite isothermal transformation diagram are the result of a combination of many factors. When applying the isothermal transformation diagram, attention must be paid to the chemical composition, austenitizing temperature and grain size of the steel used, which may lead to erroneous conclusions.
6.2 Supercooled austenite continuous cooling transition diagram
The isothermal transformation diagram reflects the isothermal transformation of supercooled austenite, so it can be used directly to guide the formulation of isothermal heat treatment processes, such as isothermal fire and isothermal quenching. In actual production, supercooled austenite is more than continuous cooling, such as quenching, normalizing and annealing. Different crafts have different speeds and different tissues. In order to study the transition law of supercooled austenite during continuous cooling, it is necessary to establish a supercooled austenite continuous cooling transition ring of various steels. The continuous cooling transition zone refers to the relationship between the transition start time and the transition time and the transition temperature when the supercooled austenite transforms into a metastable product under continuous cooling conditions of steel after austenitizing at different cooling rates. The curve, also called the CCT (Continuous Cooling Transformation) chart.
6.2.1 Establishment of a supercooled austenite continuous cooling transition diagram
The supercooled austenite continuous cooling transition diagram can be determined by expansion, metallography, and thermal analysis. A rapid dilatometer is now commonly used to determine the CCT pattern. The sample size of the rapid dilatometer is usually φ3 mm×10 mm. The sample is heated by vacuum induction heating, and the cooling rate is controlled by the program. The average cooling rate in the range of 800-500 ° C can be changed from 100000 ° C / min to 1 ° C / min. From the expansion curves of different cooling rates, the temperature and time corresponding to the transition starting point (the transition amount is 1%), the various intermediate transition points and the transition termination point (the conversion amount is 99%) can be determined. The data is recorded in a temperature-time semi-logarithmic coordinate system, and the corresponding points are connected to obtain a continuous cooling transition map. In order to improve the measurement accuracy, the metallographic method or the thermal analysis method is commonly used for fixed point proofreading.
6.2.2 Effect of cooling rate on conversion products
Figure 6-13 is a CCT diagram of a typical hypoeutectoid steel. Several curves from top left to bottom right represent cooling curves for different cooling rates. The numbers marked at the intersection of these curves with the ferrite, pearlite and bainite transition end lines refer to the volume fraction of ferrite, pearlite and bainite in the tissue after cooling to room temperature at this cold rate. The number at the lower end of the cooling curve represents the room temperature Vickers or Rockwell hardness value of the tissue obtained when cooled at this speed. The austenitizing temperature and time are often indicated in the upper right corner of the figure.
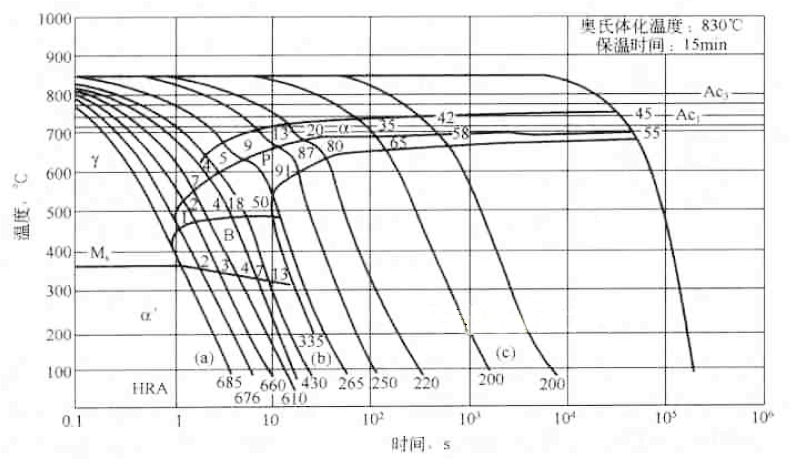
Figure 6-13 CCT curve of 0.46% C steel
In the cooling process, the hypoeutectoid steel generally enters the ferrite precipitation zone. As the cooling rate increases, the ferrite precipitation decreases less and becomes zero. When the austenite of the hypoeutectoid steel is continuously cooled in a certain cooling rate range, bainite can be formed. In the bainite transformation zone, the phenomenon that the Ms line is inclined to the lower right appears. This is because the precipitation of ferrite in the hypoeutectoid steel causes the carbon content in the untransformed austenite to increase, so that Ms The point temperature drops.
The transition process of supercooled austenite at three typical cooling rates (a), (b), and (c) is discussed below with respect to Figures 6-13, and the effect of cooling rate on the transition product is illustrated. When cooling at (a) speed (0.7 s to 500 ° C), no diffusion type phase transition occurs until the Ms point (360 ° C). The martensite transformation starts from the Ms point, and after marting to room temperature, martensite is added with a small amount of retained austenite structure, and the hardness is 685 HV. When cooling at (b) speed (5.5s to 500°C), the ferrite is precipitated at 630 °C for about 2 s, cooled to about 600 °C after 3 s, and the pearlite transformation begins after the precipitation of ferrite reaches 5%. After 6s to 480 °C, the pearlite reaches 50%, then enters the bainite transformation zone, and after 10s to 305 °C, 13% of the supercooled austenite transforms into bainite, and then begins martensite transformation. The austenite remains unchanged after cooling to room temperature. The room temperature is composed of 5% ferrite, 50% fine pearlite, 13% bainite, 30% martensite and 2% retained austenite. Composition, hardness is 335 HV. When cooling at (c) speed (260s for cooling to 500°C), ferrite is precipitated when it is cooled to 720°C for 80s, and cooled to about 680°C after 105s to form 35% ferrite and begin pearlite transformation. After 115 s cold to 655 ° C, the transformation was terminated, and a mixed structure of 35% ferrite and 65% pearlite was obtained, and the hardness was 200 HV.
6.2.3 Comparison of continuous cooling transition diagram and isothermal transition diagram
Under continuous cooling conditions, the supercooled austenite transformation occurs over a range of temperatures. The continuous cooling transition can be thought of as the sum of many isothermal transformation processes with very small temperature differences, so it can be considered that the continuous cooling transition tissue is a mixture of isothermally transformed microstructures at different temperatures.
Since both the TTT map and the CCT map use the "temperature-time" semi-logarithmic coordinates, it is possible to compare the two types of graphs on the same coordinate axis for comparison. Figure 6-14 shows the comparison of the TTT and CCT diagrams of the eutectoid carbon steel. It can be seen from the figure that the CCT map is located at the lower right of the TTT map, indicating that the continuous cooling transition temperature is lower and the incubation period is longer; and the CCT diagram of the eutectoid carbon steel has no bainite transformation zone, and the AB line is the pearlite transformation discontinuation line. That is, when the cooling curve intersects the AB line, the pearlite transformation stops, and the remaining austenite reaches the martensite transformation below the Ms point. For example, when cooling at a rate of 90 ° C / s, 50% of the austenite is converted to pearlite at point a, the remaining 50% is discontinued between point a and point b, and martensite transformation is started from point b. . The cooling rate (140 ° C / s) passing through point A is such that the pearlite transformation cannot occur, and the minimum cooling rate of 100% martensite is obtained, which is called the critical quenching speed. Point A is not the same point as the nose point N in the TTT diagram.

Figure 6-14 Comparison of TTT and CCT diagrams of carbon steel
The continuous cooling transition of alloy steel may have pearlite transformation without bainite transformation, bainite transformation without pearlite transformation, or both. The specific transformation pattern is added to the alloying elements in steel. Depending on the type and content. The effect of alloying elements on the continuous cooling transition diagram is similar to that of the isothermal transition diagram. The basic types of continuous cooling transition diagrams for alloy steels are shown in Figure 6-15.
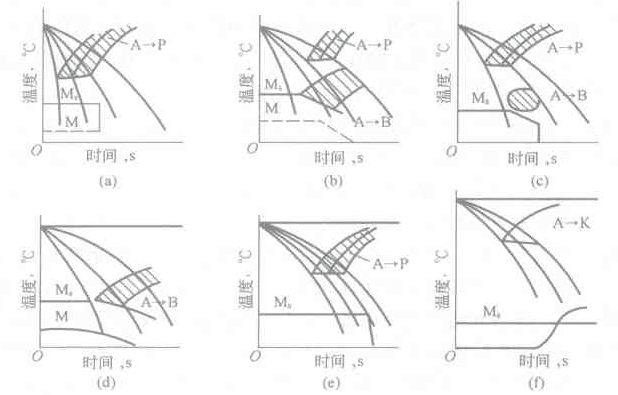
Figure 6-15 Several main types of supercooled austenite continuous cooling transition diagram
Figure 6-15 illustrates the following: Figure 6-15 (a) only pearlite transformation zone, representative components are eutectoid carbon steel and hypereutectoid carbon steel, when the carbon content is below the medium carbon, there may be bainite transformation Figure 6-15 (b) The pearlite and bainite transformation zone exist simultaneously, the two phases are separated, and the bainite transformation zone is advanced, and the representative component is an alloy structural steel with a lower carbon content. For example, 35CrMo, 35SiCr, 22CrMo; Figure 6-15 (c) pearlite and bainite transformation zone exist simultaneously, the pearlite transformation zone is ahead, the representative component is high carbon alloy tool steel, such as Crl2, Crl2Mo, 4Cr5MoVSi; Figure 6- 15(d) has only a bainite transformation zone, and the representative component is a low carbon and medium carbon alloy structural steel containing higher Cr, Ni elements, especially Mo (or W) elements, such as 18Cr2Ni4W, 35CrNi4Mo; Figure 6-l5 (e) Only the pearlite transformation zone, the representative component is medium carbon high chromium steel, such as 3Crl3, 4Crl3; Fig. 6-15(f) has only carbide precipitation line, the martensite point is lower than 0 °C, and the representative component is easy to form. Carbide austenitic steel, such as 4Cr14Ni14W2Mo steel.
6.2.4 Critical cooling rate of steel
As previously mentioned, during continuous cooling, the transition process and transition products of the supercooled austenite depend on the cooling rate of the steel. The minimum cooling rate for supercooled austenite to precipitate pro-eutectoid ferrite (hypoeutectoid steel), pro-eutectoid carbide (hyper-eutectoid steel) or not converted to pearlite or bainite is called inhibition The critical cooling rate of ferrite, pro-eutectoid carbide, pearlite and bainite. They can each be represented by a cooling rate corresponding to a cooling curve tangent to the pro-eutectoid ferrite and the pro-eutectoid carbide precipitation line or the pearlite and bainite transformation start line in the CCT diagram.
In order to obtain a complete martensite structure after quenching, the austenite should not be decomposed during the cooling process. At this time, the cooling rate of the steel should be greater than a certain critical value. This critical value is called critical quenching speed. , usually denoted by υc, which is the minimum cooling rate required to obtain complete martensite structure, including retained austenite. Υc represents the ability of steel to accept bonfire, is the main factor determining the depth of the hardened layer of steel, and is also an important basis for the rational construction of steel and the correct formulation of heat treatment process.
The critical quenching rate is related to the shape and position of the CCT curve. Figure 6-16 is a CCT diagram of a high carbon high chromium tool steel. It can be seen from the figure that the pearlitic transformation has a shorter incubation period and the bainite transformation has a longer incubation period. Therefore, the critical quenching speed of the Crl2 steel depends on the critical cooling rate for inhibiting the pearlite transformation. In contrast, the pearlite transformation of medium carbon Cr-Mn-V steel is longer than the incubation period of bainite transformation, see Figure 6-17, where the critical quenching speed will depend on the critical cooling rate for inhibiting bainite transformation.
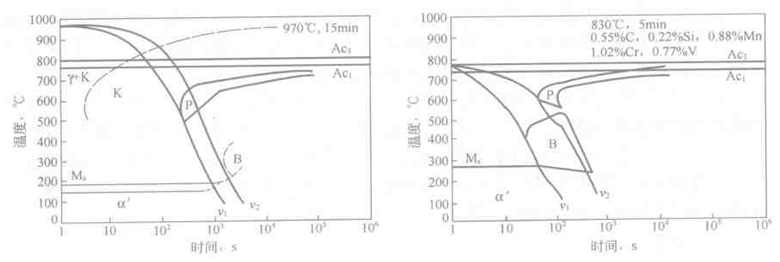
Figure 6-16 CCT curve of Cr12 steel CCT curve of carbon Cr-Mn-V steel in Figure 6-17
The critical quenching rate of hypoeutectic carbon steel and low alloy steel depends on the critical cooling rate for inhibiting the precipitation of pro-eutectoid ferrite. The critical cooling rate that inhibits the precipitation of pro-eutectoid carbides can be used to measure the tendency of austenite over-eutectoids to precipitate carbides during continuous cooling. From the CCT diagram of Cr12 steel (Fig. 6-16), it is known that the critical cooling rate for suppressing the precipitation of the pro-eutectoid carbide is large, so that carbides are easily precipitated during the quenching process.
In summary, various factors that move the CCT curve to the left will increase the critical quenching rate, while various factors that cause the CCT curve to shift to the right will reduce the critical quenching rate.
6.3 Application of supercooled austenite transformation diagram
The supercooled austenite isothermal transformation diagram and the continuous transition diagram reflect the transition law of the supercooled austenite at the critical point (A3 or A1) below isothermal or at a certain cooling rate, which can be used to formulate the heat treatment process of steel and analyze the heat treatment. After the organization and performance and the rational selection of steel and other evidence basis.
6.3.1 Application of supercooled austenite isothermal transformation diagram
Graded quenching
The staged quenching is to cool the austenitized workpiece at a cooling rate higher than the critical quenching speed to a temperature higher than the Ms point of the austenite in a stable region for a certain period of time, so that the workpiece surface and the heart The temperature difference between the parts is reduced, and then air-cooled to transform the austenite into martensite heat treatment process, as shown in Figure 6-18. Its purpose is to reduce the internal stress of quenching, reduce the deformation of the workpiece and avoid cracking. According to the TTT map, the position of the supercooled austenite relative to the stable zone can be determined, and the grading (isothermal) temperature and the holding time can be selected.
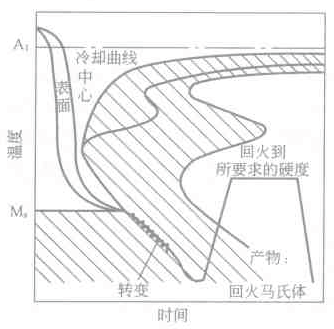
Figure 6-18 Schematic diagram of steel quenching
2. Austempering
Austempering is a heat treatment process in which austenite is rapidly cooled to a temperature higher than the critical quenching rate to a certain temperature in the lower bainite transformation zone for a certain period of time to transform austenite into lower bainite. See Figure 6-19. The isothermal temperature and the holding time can be determined from the TTT map.
3. Isothermal annealing
Isothermal annealing is a heat treatment process in which austenite is cooled to a certain temperature in the pearlite transformation zone and maintained at a certain temperature for a certain period of time to transform austenite into pearlite. Its purpose is to soften the steel and make it easy to machine. The isothermal temperature and hold time can be determined from the TTT map and the final microstructure and properties after annealing of the workpiece can be estimated.
The TTT and CCT diagrams of Cr-Mo structural steel are shown in Figure 6-20. The Cr and Mo elements make the TTT curve of the alloy steel into two parts: pearlite transformation and bainite transformation, and bainite formation during continuous cooling. It can be seen from the figure that if isothermal is carried out at 600 ° C, it can be completed in about 10 minutes to achieve the purpose of softening the steel. This is called isothermal annealing. However, if it is continuously cooled according to the D cooling curve, although it is slowly cooled for several hours, a mixed structure of ferrite, pearlite, bainite and martensite is obtained, which does not achieve the purpose of annealing and softening the steel.
4. Deformation heat treatment
Deformation heat treatment is a combination of pressure processing and quenching. The purpose is to obtain the combined effects of deformation strengthening and phase transformation strengthening. See Chapter 12 for details. For example, deformation in low temperature deformation quenching and low temperature deformation austempering is carried out in a subcooled austenite stabilization zone, followed by quenching or austempering, see Figure 6-21. According to the TTT diagram, it can be judged whether a certain steel is suitable for the two types of deformation heat treatment, and the deformation temperature and time or the austempering temperature and the holding time are selected.
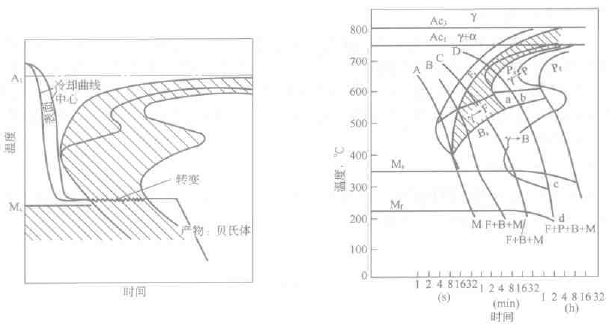
Figure 6-19 Schematic diagram of austempering of steel Figure 6-20 TTT and CCC diagram of Cr-Mo structural steel
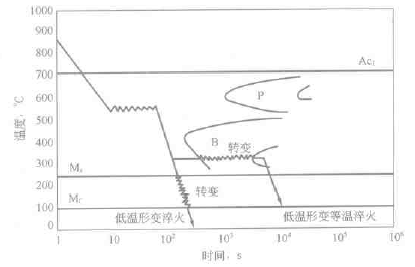
Figure 6-21 Schematic diagram of austempering process for low temperature deformation quenching and low temperature deformation
6.3.2 Application of supercooled austenite continuous cooling transition diagram
Most of the heat treatment of steel is carried out under continuous cooling conditions, so the CCT chart has a more direct guiding significance for heat treatment production.
1. Determine critical quenching speed (Vc)
The critical quenching speed represents the ability of the steel to undergo quenching, which is the main reason for determining the depth of the hardened layer of the steel. It is also one of the important basis for the rational selection of steel and the correct formulation of the heat treatment process. The cooling curve tangent to the first transition start line in the CCT diagram represents the critical quenching speed. The magnitude of the critical quenching speed is related to the shape and position of the CCT curve.
2. Predicting conversion products and performance
If the material, size, shape and heat treatment process of the workpiece are known, the corresponding cooling rate curve of the workpiece in the process can be superimposed on the CCT chart of the material, and the possible intersection can be conveniently predicted according to the intersection of the two. Transform the product and its mechanical properties, such as hardness.
3. Select cooling specification
Since the CCT map reflects the whole process of the supercooled austenite continuous cooling transition, and gives the structure and properties corresponding to each cooling solid state, it is possible to follow the CCT chart according to the size, shape and performance requirements of the workpiece. Choose the appropriate cooling specification. The method is to find the CCT map according to the steel used in the workpiece, and then analyze which cooling specifications can meet the requirements of organization and performance, and finally consider the factors such as reducing the deformation, cracking and productivity of the workpiece, and selecting the appropriate cooling medium and cooling method.
4. Reasonable use of steel
If it is difficult to select a suitable cooling medium and cooling method according to the CCT map corresponding to the workpiece steel to meet the structural and performance requirements of the workpiece, then the steel should be re-selected.
106Cm Pvc Wallpaper,Pvc White Home Decor Wallpaper,Wall Home Decoration,Bedroom Living Room Tv Sticker
JIANGSU ARTSTYLE DECORATION MATERIALS CO..LTD , https://www.jsadpvcwallpaper.com